Troubleshooting Intune MDM on Windows 10 and Windows 11 devices is a critical skill for IT administrators and endpoint managers. Common issues such as policy sync failures, missing apps, or configuration drift can disrupt productivity and security. In this guide, we’ll walk through basic Intune MDM troubleshooting steps, including policy validation, diagnostics report generation, log collection, and Intune Management Extension (IME) analysis. Whether you’re managing a small business or an enterprise environment, these step-by-step Intune troubleshooting techniques will help you quickly identify and resolve device management problems.
How to Validate Intune Policies Status
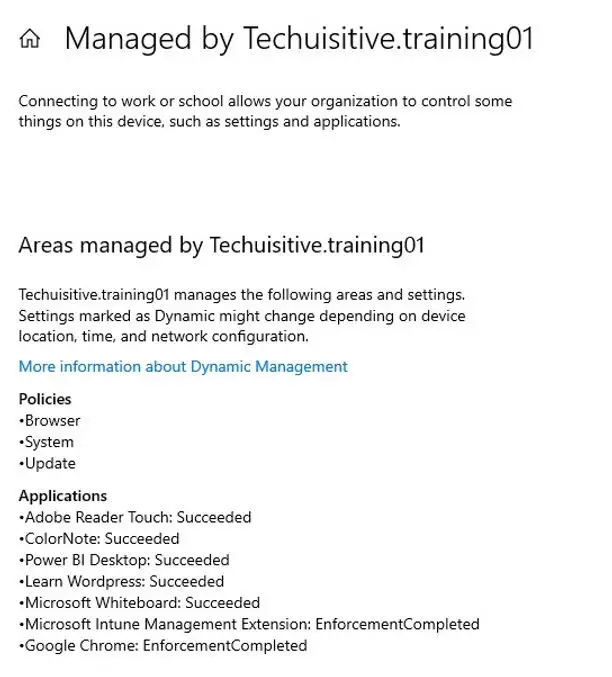
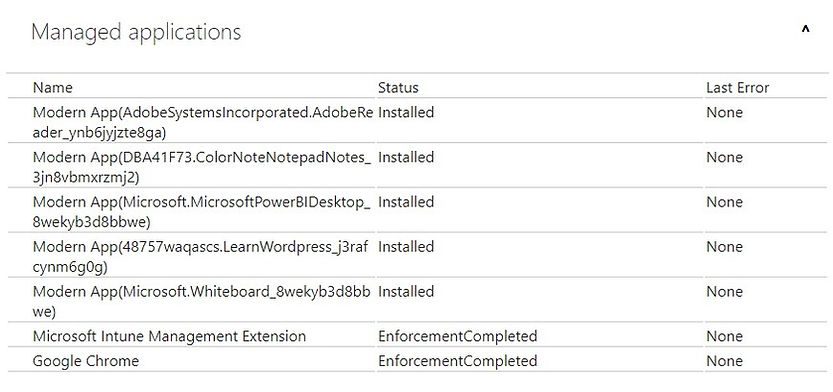
The Access work or school page in Windows 10 settings is a quick starting point for Intune MDM troubleshooting. It provides a snapshot of the device’s management status, including applied policies and deployed applications. Under the Policies section, you can view all configuration policies currently enforced by your organization. Likewise, the Applications section lists the apps that are being managed through Intune. Reviewing this page is often the fastest way to confirm whether required policies and applications have successfully synced to the device before moving on to deeper diagnostics.
Check Device Sync Status
If you do not see the expected policies/applications applied, then you can check the Sync status on the same page. You can force sync as well from here.
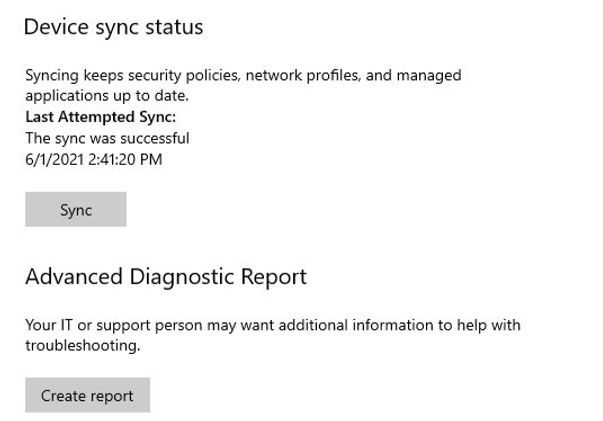
Generate a Diagnostic Report
You can also generate a diagnostics report in HTML format using the “Create report” button (see the above screenshot). Here are the complete steps.
- Go to Settings > Access Work and School
- Select Tenant <Tenant>’s Azure AD > and click on Info
- Scroll down to the bottom and click on Create report
The report will be saved to:
C:\Users\Public\Public Documents\MDMDiagnostics\MDMDiagReport.html
Generate detailed diagnostics report
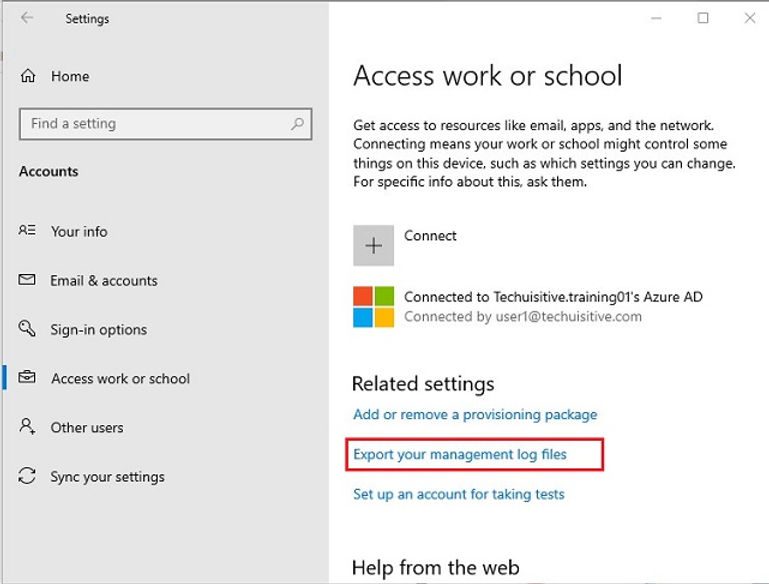
A detailed MDM diagnostics report can be generated directly from the Access work or school page in Windows 10/11. Under the Related settings section, you’ll find the Export your management log files option, which allows you to collect Intune diagnostics logs for troubleshooting policy sync and device management issues. If the settings window is maximized, this option appears at the top-right corner of the screen. Exporting these log files provides administrators with a comprehensive view of applied Intune policies, configuration profiles, and potential errors, making it an essential step in Intune MDM troubleshooting.
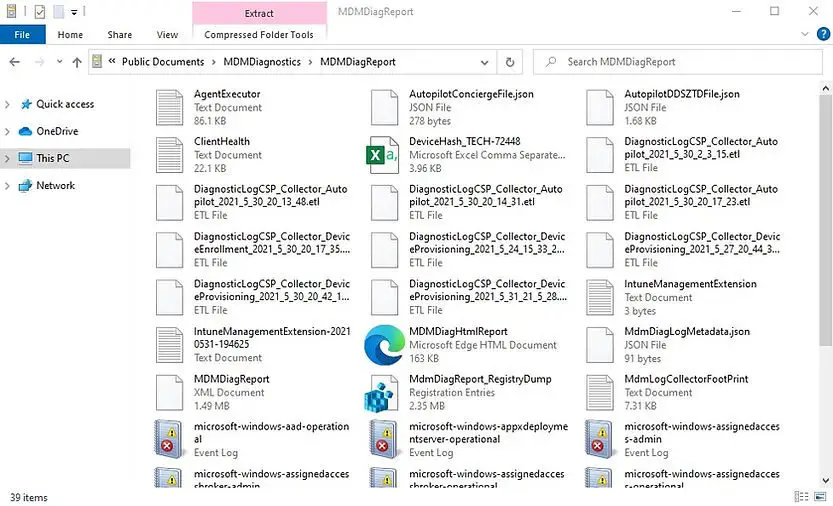
The diagnostics report is saved as a CAB file (MDMDiagReport.cab) in the following location:C:\Users\Public\Documents\MDMDiagnostics
This file contains detailed Intune MDM diagnostics logs, including applied policies and configuration data, and can be used by administrators for troubleshooting Windows 10/11 device management issues.
Collect diagnostics log from Intune Admin Center
You can collect diagnostics logs directly from the Intune Admin Center by following the steps below. These logs provide comprehensive data for Intune MDM troubleshooting, including details from the MDM agent, MECM client, Windows Autopilot, registry keys, event viewer logs, networking information, and other critical components. Reviewing these logs helps administrators quickly identify configuration issues, policy sync failures, and connectivity problems across managed Windows 10/11 devices.
📋 Collecting Diagnostics Logs from Endpoint Manager Admin Center
- Step 1: Navigate to the Intune admin center
- In the left‑hand navigation pane, select Devices.
- From the list of enrolled devices, choose the specific Windows 10/11 device you want to troubleshoot.
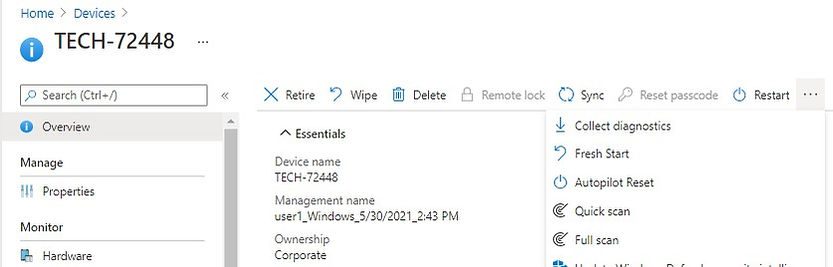
- Step 2: Access the Collect Diagnostics option
- Once inside the device blade, go to the Overview section.
- In the top menu, click on Collect diagnostics.
- This option triggers the collection of Intune MDM logs, Autopilot logs, registry keys, event viewer logs, networking data, and MECM client logs.
- The collected package is automatically uploaded to the Intune admin portal for review.
- Step 3: Confirm the action
- A confirmation prompt will appear asking if you want to proceed.
- Click Yes to start the diagnostics collection process.
- The process may take several minutes depending on the device’s configuration and log size.
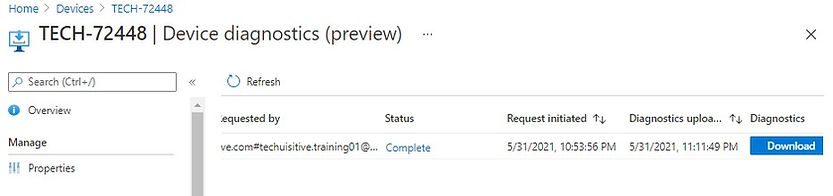
- Once complete, the logs will be available under the Device → Collect diagnostics history tab for download and analysis.
The log files will be organized in different folders named as numbers (1,2,3….) which contain the details mentioned above.
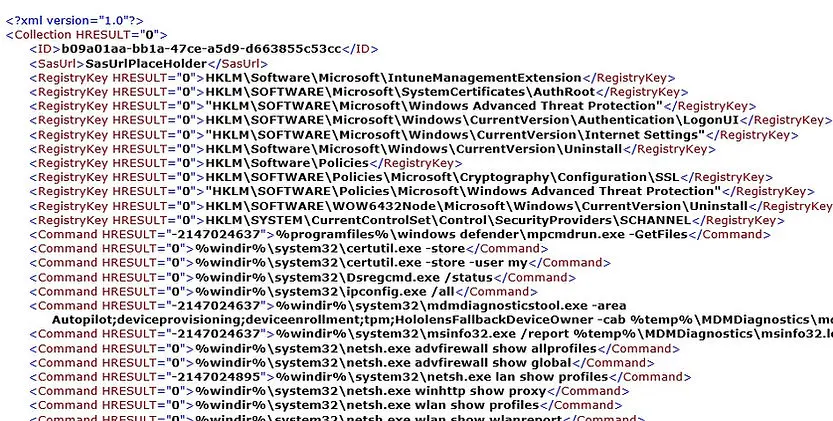
The “result.xml” file in the root folder will have details of the information collected by the diagnostics tool. Please check Microsoft documentation to know more about the data collected by the diagnostics tool.
Intune Management Extension
The Intune management extension supplements the in-box Windows 10 MDM features. It allows Microsoft Intune to run the PowerShell scripts on Windows 10 devices.
The IME runs as a service called “Microsoft Intune Management Extension”. The service name is IntuneManagementExtension.
IME logs are located in C:\ProgramData\Microsoft\IntuneManagementExtension\Logs folder. You can use CMTrace.exe, provided with Configuration manager,to view these logs.
- AgentExecutor
- ClientHealth
- IntuneManagementExtension
The full content of the script is logged in the IntuneManagementExtension log which can be useful in troubleshooting.

Related Posts
- Win32 App Deployment failed with error code 0x80070643
- Win32 App Deployment Failed with Error 0x87D1041C
- Win32 App Deployment failed with error 0x87D300C9
- Win32 App failed with error code 0x80070653
- That account info didn’t work – error when disconnecting Windows 10 / 11 Work or School account
- Intune – Windows 10 MDM- Basic troubleshooting
- Deploying Microsoft 365 Apps Stuck in Downloading in Company Portal
- Windows 10 / 11 Operating System Build Versions
- MDM Enroll: Device Credential, Failed (Unknown Win32 Error code : 0xcaa9001f
- Microsoft Endpoint Manager: Error Code Reference
- Intune Bulk Enrollment with Provisional Package failed Error 0xCAA2000C
- How to Fix Intune Win32 App Deployment Error 0x87D30006